NFL Penalty Trends - Game Day
This post will look specifically at penalty trends by day of the week and the week of the season. To look at trends by game environment, such as weather and turf type, see NFL Penalty Trends - Game Environment.
Game Day Trends
To look at trends by the day of the week the game is played, we have to keep in mind there are exceedingly more games played on Sundays than any other day of the week. To control for this, I am going to determine how many games were played each day from 2013 - 2019.
| Game Count by Day of the Week | ||||
|---|---|---|---|---|
| Season | Monday | Saturday | Sunday | Thursday |
| 2013 | 17 | 0 | 222 | 17 |
| 2014 | 18 | 2 | 218 | 18 |
| 2015 | 17 | 2 | 219 | 18 |
| 2016 | 17 | 13 | 208 | 18 |
| 2017 | 18 | 4 | 217 | 17 |
| 2018 | 17 | 4 | 218 | 17 |
| 2019 | 17 | 3 | 219 | 17 |
| Total | 121 | 28 | 1,521 | 122 |
| Average | 17 | 4 | 217 | 17 |
Now we’re able to take a quick look at the number of penalties per game by day of the week:
| Penalties by Day of the Week | ||||
|---|---|---|---|---|
| Regular Season Only | ||||
| Season | Thursday | Sunday | Monday | Saturday |
| Total Penalties | ||||
| 2013 | 243.00 | 3,128.00 | 225.00 | 0.00 |
| 2014 | 271.00 | 3,540.00 | 229.00 | 48.00 |
| 2015 | 270.00 | 3,608.00 | 280.00 | 36.00 |
| 2016 | 271.00 | 3,375.00 | 236.00 | 174.00 |
| 2017 | 323.00 | 3,369.00 | 277.00 | 58.00 |
| 2018 | 242.00 | 3,477.00 | 269.00 | 60.00 |
| 2019 | 294.00 | 3,535.00 | 268.00 | 35.00 |
| Average | 273.43 | 3,433.14 | 254.86 | 58.71 |
| Penalties per Game | ||||
| 2013 | 14.29 | 14.09 | 13.24 | 0.00 |
| 2014 | 15.06 | 16.24 | 12.72 | 24.00 |
| 2015 | 15.00 | 16.47 | 16.47 | 18.00 |
| 2016 | 15.06 | 16.23 | 13.88 | 13.38 |
| 2017 | 19.00 | 15.53 | 15.39 | 14.50 |
| 2018 | 14.24 | 15.95 | 15.82 | 15.00 |
| 2019 | 17.29 | 16.14 | 15.76 | 11.67 |
| Average | 15.70 | 15.81 | 14.76 | 13.79 |
Week of Season
| Penalties By Week of Season | |||||||||||||||||
|---|---|---|---|---|---|---|---|---|---|---|---|---|---|---|---|---|---|
| Regular Season Only | |||||||||||||||||
| 1 | 2 | 3 | 4 | 5 | 6 | 7 | 8 | 9 | 10 | 11 | 12 | 13 | 14 | 15 | 16 | 17 | |
| Total Penalties | |||||||||||||||||
| 2013 | 248.00 | 228.00 | 234.00 | 215.00 | 200.00 | 214.00 | 256.00 | 176.00 | 161.00 | 175.00 | 230.00 | 197.00 | 214.00 | 228.00 | 236.00 | 212.00 | 172.00 |
| 2014 | 269.00 | 284.00 | 266.00 | 203.00 | 260.00 | 246.00 | 235.00 | 248.00 | 189.00 | 188.00 | 192.00 | 248.00 | 269.00 | 244.00 | 271.00 | 257.00 | 219.00 |
| 2015 | 247.00 | 357.00 | 272.00 | 264.00 | 235.00 | 225.00 | 232.00 | 231.00 | 200.00 | 219.00 | 231.00 | 253.00 | 239.00 | 253.00 | 268.00 | 244.00 | 224.00 |
| 2016 | 240.00 | 268.00 | 271.00 | 275.00 | 204.00 | 254.00 | 256.00 | 230.00 | 237.00 | 214.00 | 226.00 | 232.00 | 224.00 | 278.00 | 214.00 | 221.00 | 212.00 |
| 2017 | 247.00 | 270.00 | 301.00 | 257.00 | 228.00 | 210.00 | 233.00 | 201.00 | 206.00 | 225.00 | 199.00 | 246.00 | 241.00 | 241.00 | 266.00 | 235.00 | 221.00 |
| 2018 | 293.00 | 243.00 | 288.00 | 219.00 | 239.00 | 216.00 | 180.00 | 236.00 | 208.00 | 170.00 | 184.00 | 231.00 | 311.00 | 284.00 | 275.00 | 267.00 | 204.00 |
| 2019 | 305.00 | 307.00 | 262.00 | 277.00 | 294.00 | 231.00 | 214.00 | 250.00 | 222.00 | 228.00 | 236.00 | 228.00 | 238.00 | 218.00 | 216.00 | 204.00 | 202.00 |
| Average | 264.14 | 279.57 | 270.57 | 244.29 | 237.14 | 228.00 | 229.43 | 224.57 | 203.29 | 202.71 | 214.00 | 233.57 | 248.00 | 249.43 | 249.43 | 234.29 | 207.71 |
| Penalties Per Game | |||||||||||||||||
| 2013 | 15.50 | 14.25 | 14.62 | 14.33 | 14.29 | 14.27 | 17.07 | 13.54 | 12.38 | 12.50 | 15.33 | 14.07 | 13.38 | 14.25 | 14.75 | 13.25 | 10.75 |
| 2014 | 16.81 | 17.75 | 16.62 | 15.62 | 17.33 | 16.40 | 15.67 | 16.53 | 14.54 | 14.46 | 13.71 | 16.53 | 16.81 | 15.25 | 16.94 | 16.06 | 13.69 |
| 2015 | 15.44 | 22.31 | 17.00 | 17.60 | 16.79 | 16.07 | 16.57 | 16.50 | 15.38 | 15.64 | 16.50 | 15.81 | 14.94 | 15.81 | 16.75 | 15.25 | 14.00 |
| 2016 | 15.00 | 16.75 | 16.94 | 18.33 | 14.57 | 16.93 | 17.07 | 17.69 | 18.23 | 15.29 | 16.14 | 14.50 | 14.93 | 17.38 | 13.38 | 13.81 | 13.25 |
| 2017 | 16.47 | 16.88 | 18.81 | 16.06 | 16.29 | 15.00 | 15.53 | 15.46 | 15.85 | 16.07 | 14.21 | 15.38 | 15.06 | 15.06 | 16.62 | 14.69 | 13.81 |
| 2018 | 18.31 | 15.19 | 18.00 | 14.60 | 15.93 | 14.40 | 12.86 | 16.86 | 16.00 | 12.14 | 14.15 | 15.40 | 19.44 | 17.75 | 17.19 | 16.69 | 12.75 |
| 2019 | 19.06 | 19.19 | 16.38 | 18.47 | 19.60 | 16.50 | 15.29 | 16.67 | 15.86 | 17.54 | 16.86 | 16.29 | 14.88 | 13.62 | 13.50 | 12.75 | 12.62 |
| Average | 16.66 | 17.47 | 16.91 | 16.43 | 16.40 | 15.65 | 15.72 | 16.18 | 15.46 | 14.81 | 15.27 | 15.43 | 15.63 | 15.59 | 15.59 | 14.64 | 12.98 |
We can see that the number of penalties per games generally decreases over the course of the season, with a small increase in weeks 11 to 13.
Time
So far, we have seen that penalties occur more earlier in the season and less on Monday nights. Now, let’s look at penalties by start time.
| Penalties by Start Time | |||
|---|---|---|---|
| Penalties Include Regular Season Only | |||
| Season | Early Afternoon |
Mid Afternoon |
Night |
| Total Penalties | |||
| 2013 | 2,396.00 | 589.00 | 611.00 |
| 2014 | 2,894.00 | 494.00 | 700.00 |
| 2015 | 2,998.00 | 499.00 | 697.00 |
| 2016 | 2,866.00 | 550.00 | 640.00 |
| 2017 | 2,813.00 | 521.00 | 693.00 |
| 2018 | 2,923.00 | 520.00 | 605.00 |
| 2019 | 2,850.00 | 637.00 | 645.00 |
| Average | 2,820.00 | 544.29 | 655.86 |
| Penalties Per Game | |||
| 2013 | 13.93 | 15.10 | 13.58 |
| 2014 | 16.17 | 17.03 | 14.58 |
| 2015 | 16.38 | 17.82 | 15.49 |
| 2016 | 16.01 | 16.18 | 14.88 |
| 2017 | 15.63 | 15.79 | 16.12 |
| 2018 | 16.33 | 14.44 | 14.76 |
| 2019 | 16.19 | 15.54 | 16.54 |
| Average | 15.81 | 15.99 | 15.13 |
Night games see almost a full penalty less on average than games in the early & mid afternoon.
| Penalties by Quarter | |||||
|---|---|---|---|---|---|
| Penalties Include Regular Season Only | |||||
| Season | 1 | 2 | 3 | 4 | Overtime |
| 2013 | 729 | 1022 | 914 | 902 | 29 |
| 2014 | 861 | 1166 | 991 | 1059 | 11 |
| 2015 | 890 | 1214 | 1005 | 1060 | 25 |
| 2016 | 861 | 1147 | 945 | 1072 | 31 |
| 2017 | 863 | 1156 | 910 | 1074 | 24 |
| 2018 | 847 | 1184 | 924 | 1067 | 26 |
| 2019 | 872 | 1188 | 951 | 1116 | 5 |
| Average | 846.14 | 1,153.86 | 948.57 | 1,050.00 | 21.57 |
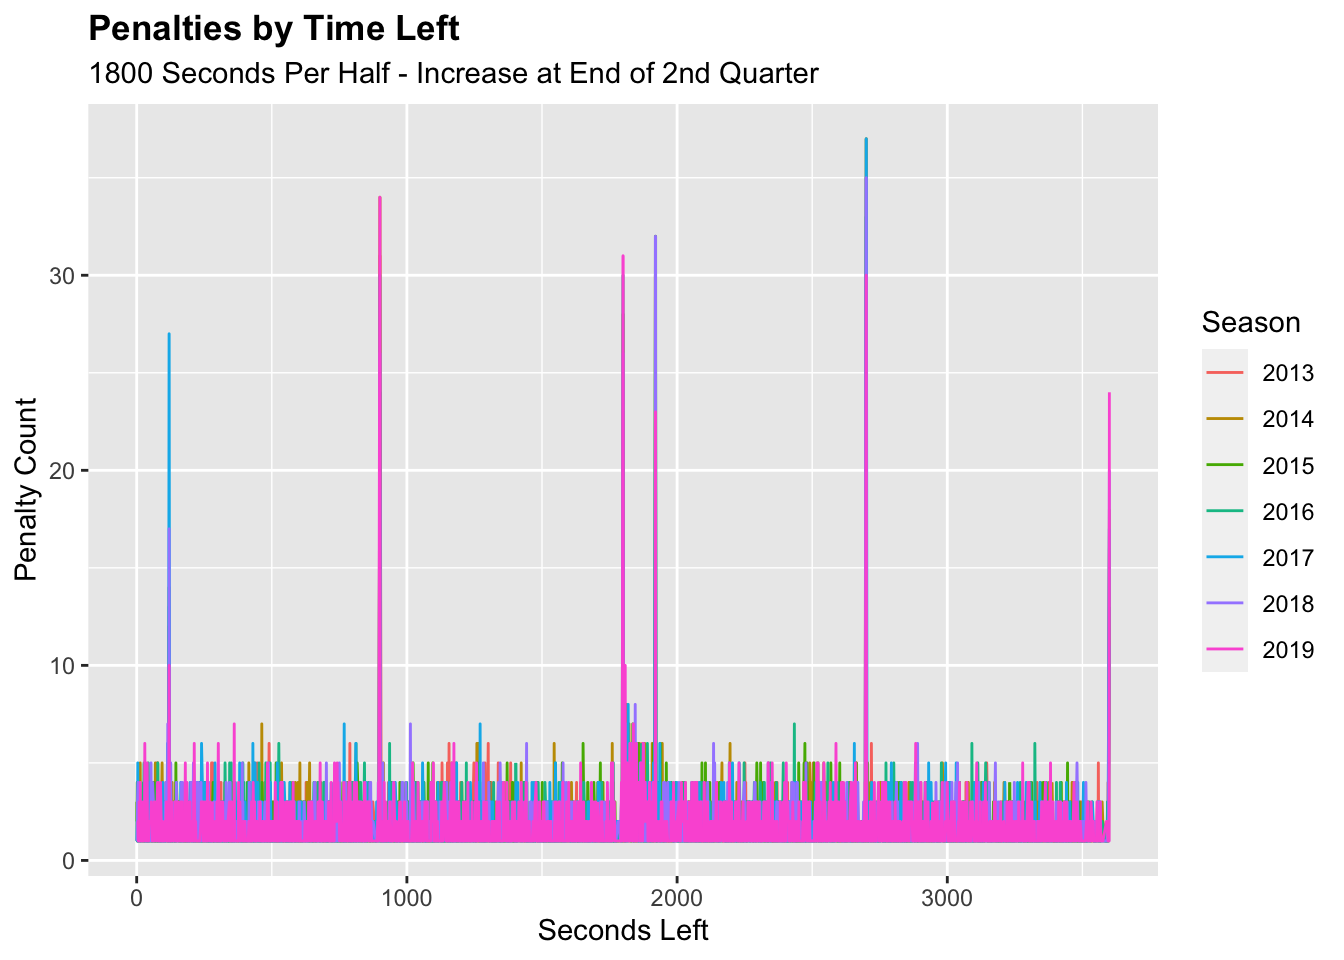
I chose not to standardize this by quarter since all games have 4 quarters. Granted, not all games have overtime, but that isn’t providing us with a large enough sample size to make a steadfast conclusion. From the table and first graph we can see that the second and fourth quarters see the most penalties.
While the last graph is a bit hard to look at, we can notice a slight increase in penalties at the end of the second quarter. Note that the X-Axis represents the seconds remaining in the game, and there are 900 seconds in each quarter.
Play Number in Series
Each season follows the same trend here, almost exactly. We see the most penalties during the 3rd play of a series. Granted, not all series can be guaranteed more than 4 plays (really, not all series can be guaranteed more than 1 play, considering potential turnovers), so we can make some interesting conclusions up through the fourth play. Keeping in mind the note about turnovers, we would assume to see the most penalties on the 1st play of a series, or at least for the 1st 3 plays to see a somewhat equal amount of penalties. However, we see a peak at the 3rd play (if a series got to the 3rd play, there had to be a 1st and 2nd) which tells us that it is significant that there are fewer plays on the 1st and 2nd penalties. Plays after that, it is not reasonable to draw conclusions for from this graph, due to the fact that not all series have more than 4 plays.
Down and Distance
| Penalties by Down | |||||
|---|---|---|---|---|---|
| Third & Fourth Downs See Increased Likelihood for Penalties | |||||
| Season | Kickoff/ Extra Point |
1st | 2nd | 3rd | 4th |
| Total Penalties | |||||
| 2013 | 172.00 | 1,141.00 | 897.00 | 860.00 | 526.00 |
| 2014 | 193.00 | 1,305.00 | 1,032.00 | 995.00 | 563.00 |
| 2015 | 208.00 | 1,332.00 | 1,063.00 | 1,026.00 | 565.00 |
| 2016 | 203.00 | 1,326.00 | 1,029.00 | 974.00 | 524.00 |
| 2017 | 210.00 | 1,243.00 | 1,028.00 | 981.00 | 565.00 |
| 2018 | 258.00 | 1,343.00 | 1,043.00 | 896.00 | 508.00 |
| 2019 | 219.00 | 1,337.00 | 1,071.00 | 988.00 | 517.00 |
| Average | 209.00 | 1,289.57 | 1,023.29 | 960.00 | 538.29 |
| Penalties Per Down | |||||
| 2013 | 0.04 | 0.07 | 0.08 | 0.11 | 0.13 |
| 2014 | 0.05 | 0.08 | 0.09 | 0.13 | 0.14 |
| 2015 | 0.05 | 0.08 | 0.09 | 0.14 | 0.14 |
| 2016 | 0.05 | 0.08 | 0.09 | 0.13 | 0.13 |
| 2017 | 0.06 | 0.08 | 0.09 | 0.13 | 0.14 |
| 2018 | 0.06 | 0.09 | 0.09 | 0.13 | 0.13 |
| 2019 | 0.06 | 0.09 | 0.09 | 0.14 | 0.13 |
| Average | 0.05 | 0.08 | 0.09 | 0.13 | 0.14 |
When considering the frequency of which each down occurs, there is an increase in the likelihood of a penalty on 3rd & 4th downs.
Moving on to Distance - there is naturally a big spike with 10 yards to go, as it is the most common distance.
If we look at the penalties as the frequency within each down, we get a different graph:
| Penalties by Distance Per 100 Plays | |||||||
|---|---|---|---|---|---|---|---|
| Penalties Include Regular Season Only | |||||||
| Season | 0 | 1-3 | 4-6 | 7-10 | 11-15 | 16-20 | Over 20 |
| 2013 | 4.244817 | 8.351220 | 10.12238 | 8.332978 | 9.503022 | 9.970888 | 10.89109 |
| 2014 | 4.898477 | 10.526316 | 11.12504 | 9.369706 | 11.666140 | 11.011700 | 13.87025 |
| 2015 | 5.230073 | 10.641628 | 11.10912 | 9.530351 | 12.008943 | 11.715481 | 12.79826 |
| 2016 | 5.118507 | 10.124368 | 10.62742 | 9.284594 | 12.204990 | 12.977650 | 11.49897 |
| 2017 | 5.513258 | 10.569607 | 10.62555 | 9.271465 | 11.313756 | 11.891892 | 13.71681 |
| 2018 | 6.381400 | 9.656138 | 10.90775 | 9.492773 | 11.707152 | 12.163978 | 11.24122 |
| 2019 | 5.517763 | 9.744541 | 11.26433 | 9.887155 | 11.290844 | 10.209258 | 13.21185 |
| Average | 5.27 | 9.94 | 10.83 | 9.31 | 11.38 | 11.42 | 12.46 |
Although there are less data points for the longer distances, leading to skewness, this graph shows that the spike around ten yards can be explained by the many plays with 10 yards to go. Out of the categories under 10 yards to go, the mid-distance actually sees the highest penalties, which is surprising to me.
Score Differential
| Penalties by Score Differential Per 100 Plays | |||||
|---|---|---|---|---|---|
| Penalties Include Regular Season Only | |||||
| Season | 3 Poss or More |
2 Poss | 1 TD | Field Goal or Less |
Tied |
| 2013 | 2.82 | 6.43 | 15.51 | 6.31 | 6.07 |
| 2014 | 4.43 | 7.51 | 14.21 | 6.80 | 6.81 |
| 2015 | 3.18 | 7.90 | 17.09 | 7.34 | 7.74 |
| 2016 | 2.57 | 7.42 | 21.28 | 7.72 | 6.62 |
| 2017 | 3.34 | 7.04 | 17.64 | 7.23 | 7.58 |
| 2018 | 3.08 | 7.75 | 16.72 | 7.29 | 7.38 |
| 2019 | 3.25 | 8.39 | 19.49 | 7.66 | 7.13 |
| Average | 3.24 | 7.49 | 17.42 | 7.19 | 7.05 |
We can see from the above table how the frequency of penalties changes depending on the score differential at the given time of the play.
In the below graph, the numbers are taken from summing (across all season) the plays in each score differential category and the penalties in each score differential category. These numbers vary a small amount from the summary row in the above table because that is the average of each season’s number.